My CGM Experiment
Earlier this month, I wore a Dexcom G6 for a week to monitor my blood sugar levels. I kept a detailed food diary during the week, and tracked absolutely everything that I consumed (except water). This post is the summary of my experience, with a review of the data and my key takeaways.
What & Why
The G6 is a continuous glucose monitor (CGM for short), and consists of two pieces: a sensor that pokes slightly under the skin to take blood glucose measurements, and a Bluetooth transmitter that sends the readings to the accompanying app on a smartphone. It is one of the latest generation devices that are minimally invasive, do not require any calibration, and can be worn continuously for up to 10 days (per sensor). The measurement is fairly accurate, but since the levels are taken from the interstitial fluid (in the tissue under the skin) rather than the blood stream, there is an inherent delay in the responsiveness of the reading, about 5 minutes.
The device is mostly meant for people suffering from diabetes, but recently, there’s been a growing trend for healthy people to monitor their blood glucose levels, in order to help with diet. I fall in the latter group, and mainly wanted to see how various foods and activities in my life impacts blood sugar levels. Over the seven days that I wore the sensor, I slightly broadened the types of diets that I routinely encounter, in an effort to gather more varied data.
The Data
Before we dive into it, here are some notes and caveats about the data:
- The first 12 hours of data has been discarded, because the readings are quite erratic and unreliable. A brief search online about this behavior seems to reveal that it’s a common issue with CGMs, attributed to the sensor needing some time to set-in and self-calibrate before readings become accurate
- The sensor takes a reading every 5 minutes and records it, so each day’s graph consists of 288 data points. The measurements are shown in $mmol/L$, and the y-axis is range limited to between 4 and 11, the generally accepted minimum and maximum blood glucose levels for healthy adults respectively
- The daily data has been annotated with all the food and drink (except water) intakes that I consumed, as noted in my food diary
- I follow the “18:6” TRF schedule (time-restricted feeding, also known as IF, or intermittent fasting). It means that I am food-restricted for 18 hours every day, with a 6-hour feeding window to eat. My typical feeding window is between noon and 6:00 PM, so you will not see any breakfast in the data. For two of the seven days, I did followed the one-meal-a-day schedule, to see the impact of a longer fast
- The meals are not standardized by calorie amount, I simply ate how I would normally eat. So the differences in their effects on the blood sugar levels are in part due the difference in their caloric content
- Personal health data visualization is still in its infancy, and can only be described as terrible. The Apple built-in iOS Health app notably does not even offer the granularity needed to see all the data points for blood glucose, and is restricted to only showing hourly ranges. Luckily, raw data export is fairly simple, and the graphs below are done by me manually based on the export
Here is the data.
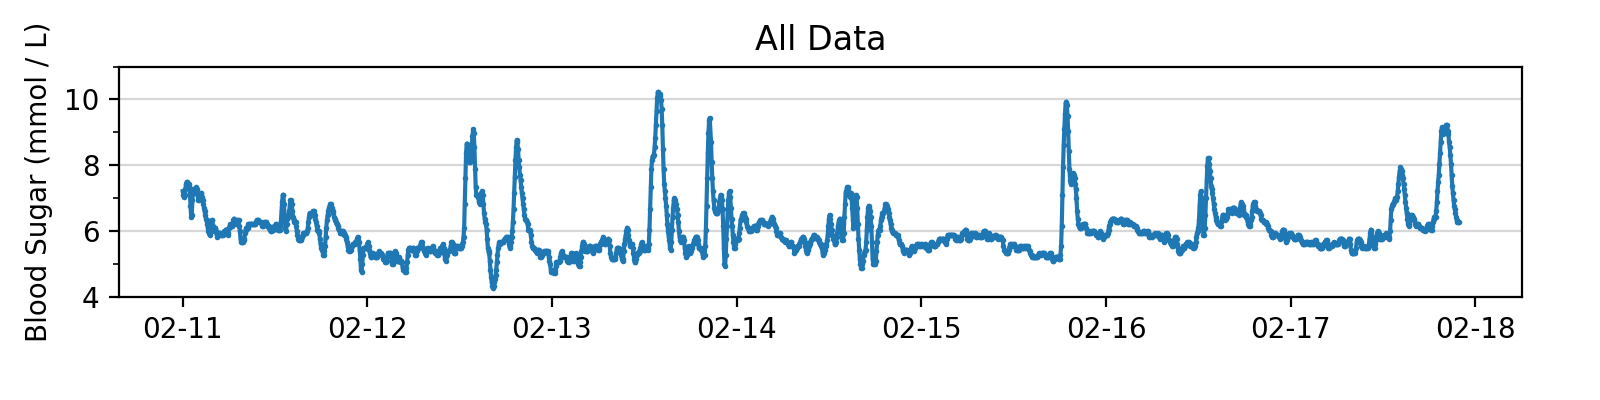
This is the data for the entire week, for an overview. But it isn’t too useful so let’s dig deeper with daily data.
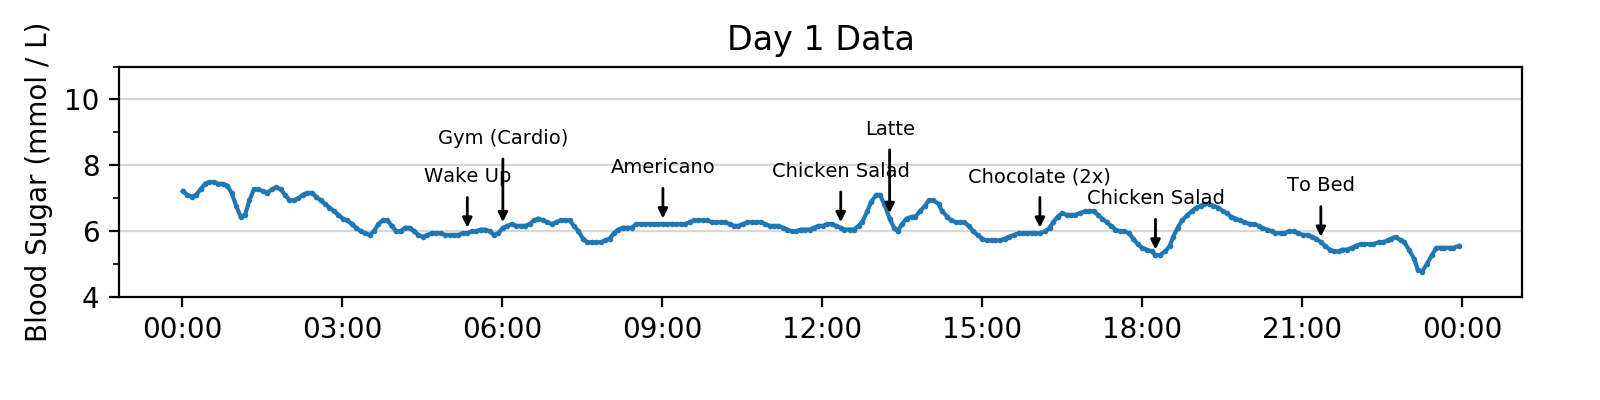
Day 1 was a fairly regular day. Interesting things to note include the lack of any impact from the hour-long heavy cardio exercise I did in the morning, and the quite noticeable effect of the two small pieces of chocolates I had in the afternoon (around 4:00 PM).
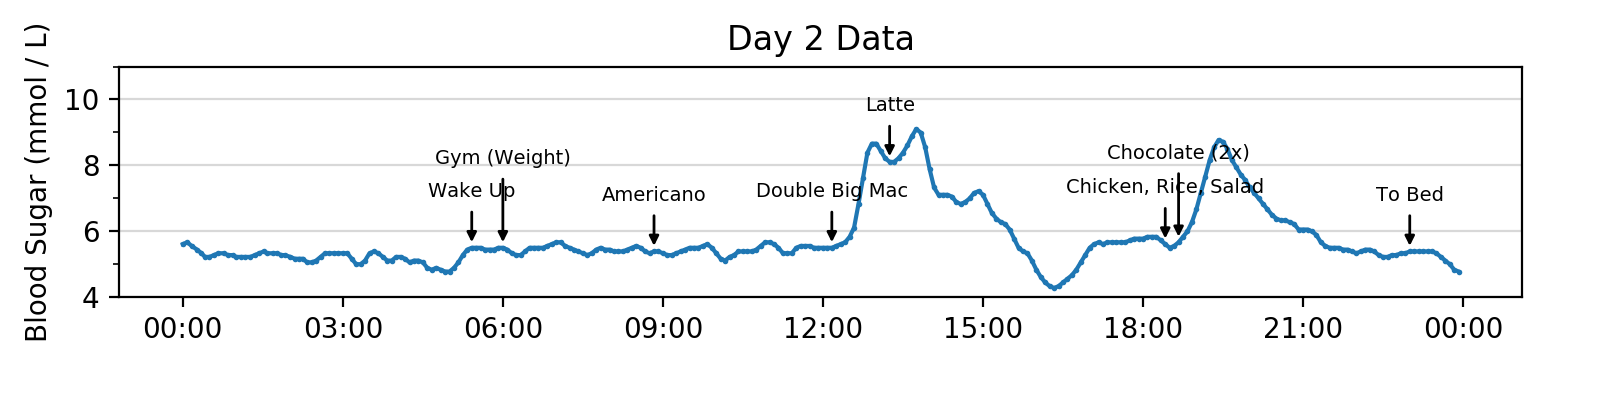
Day 2 was when I decided to test out some junk food, and had McDonald’s to see what the impact would be. The heavy meal actually caused a “sugar crash” at around 4:30 PM, where the glucose level dipped below the 4.5 $mmol/L$ lower limit of the monitoring app and triggered a low blood sugar alert.
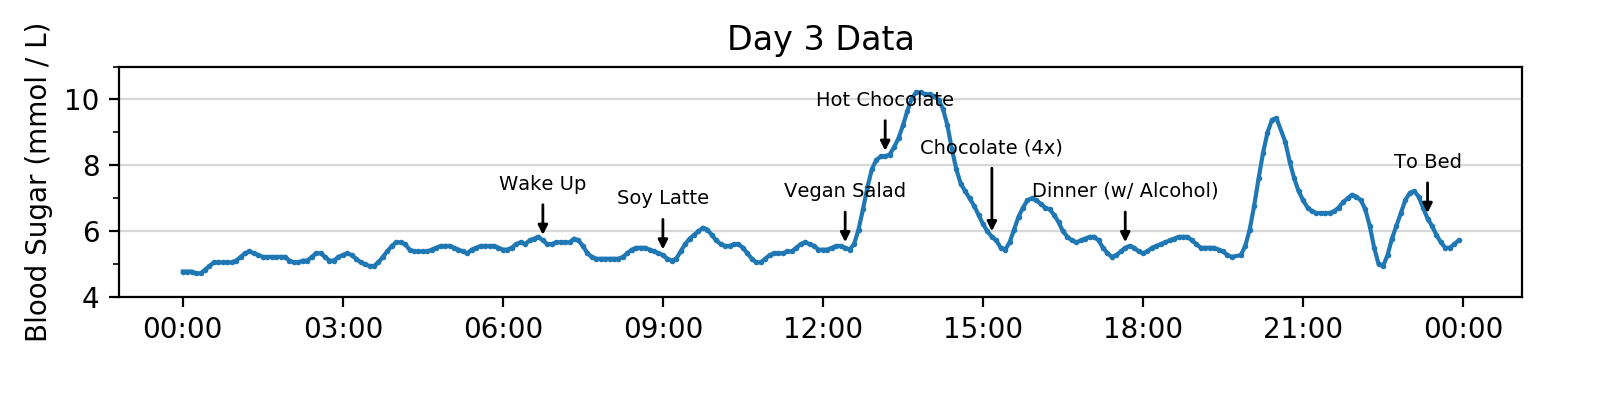
Day 3 was deliciously filled with lots of chocolates, as reflected by the massive “mountains” created in the graph. Note the elevated impact of the soy latte in the morning, compared to the Americano that I typically have in mornings.
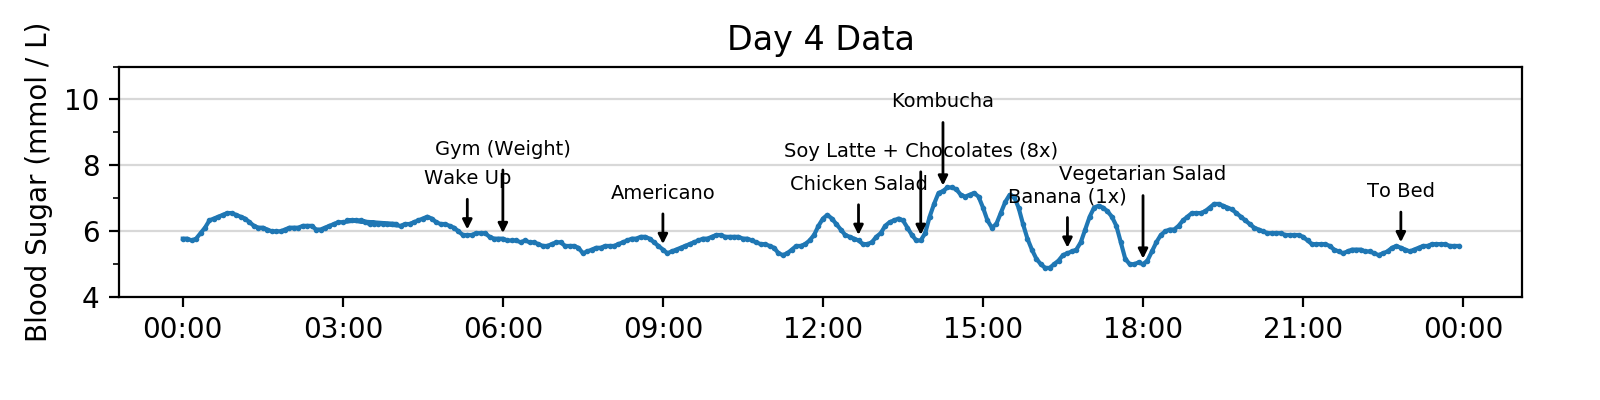
Day 4 was a relatively snack heavy day, for me at least. The entire afternoon’s glucose levels are constantly elevated.
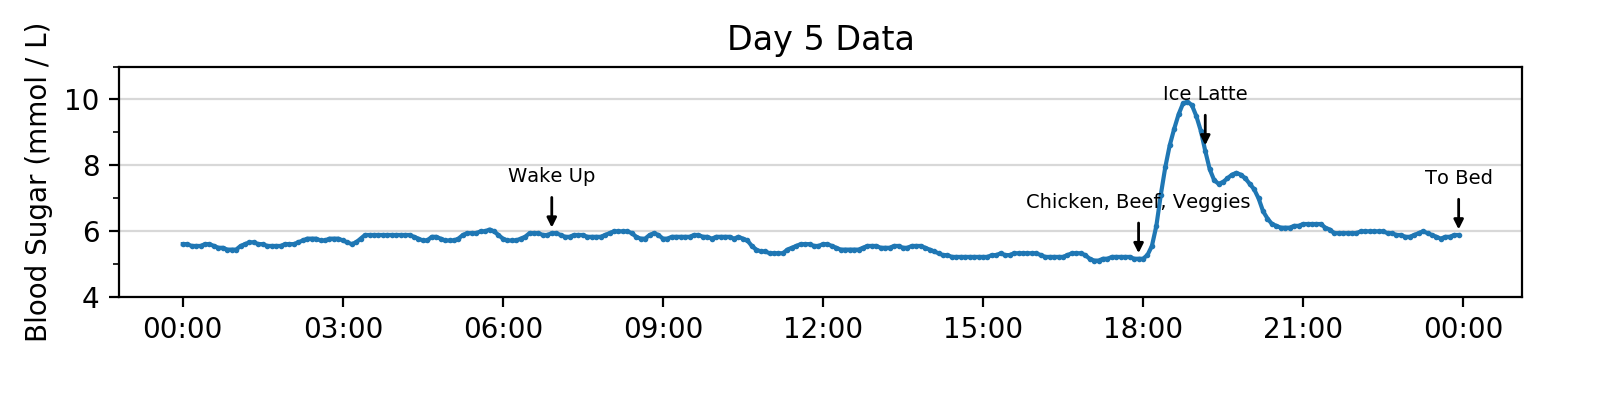
Day 5 was my first 24-hour fast test, with one meal at dinner time only. This produced a noticeably lower average glucose level in the second half of the afternoon, to about 5.2 $mmol/L$ (compared to the pre-prandial level of 5.5-5.8 $mmol/L$ with my typical 18:6 TRF).
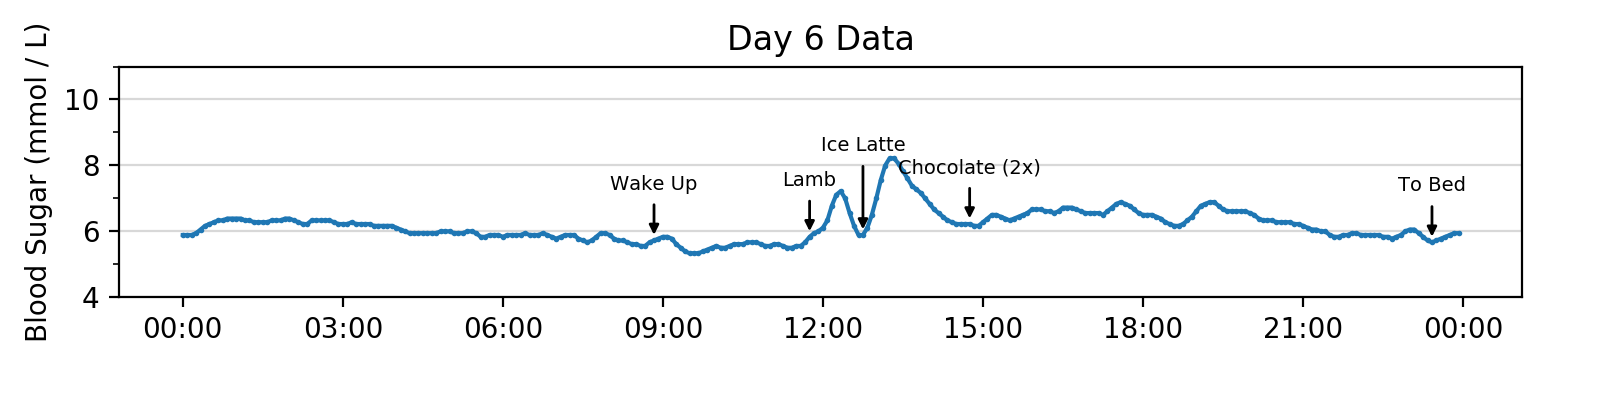
Day 6 was my second 24-hour fast, this time with one meal at lunch time only. It did not produce the same lower average glucose level as seen in the previous day, even though the fast lasted the same amount of time.
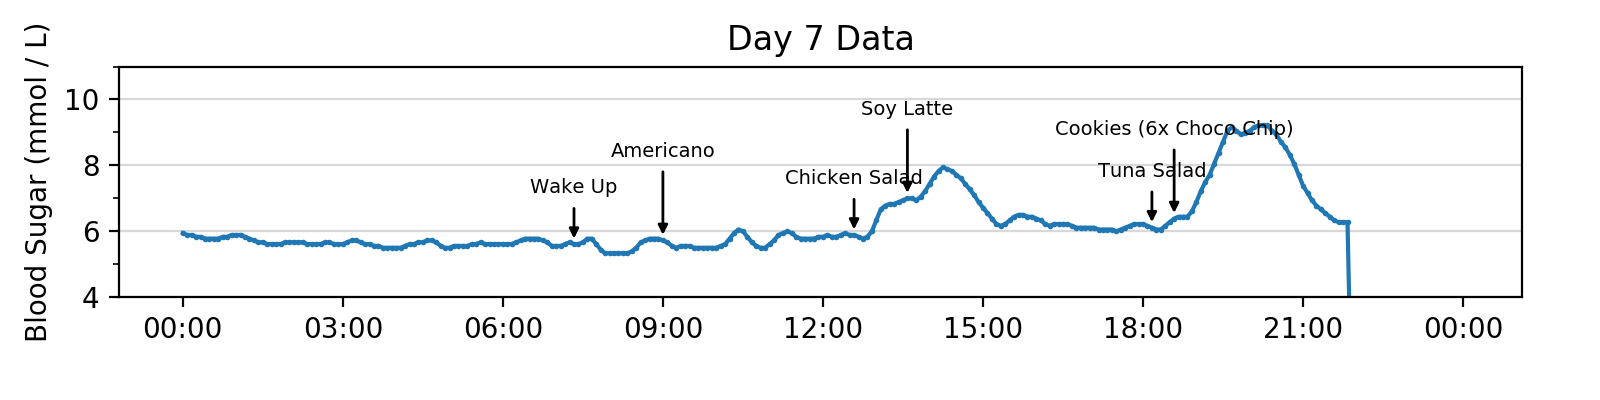
Day 7 was mostly a regular day. Data for the last 2 hours is missing because I took the sensor off before bed. Interesting thing to note: chocolate chip cookies are quite “deadly”.
Takeaways & Thoughts
On Diet
Carbs have a massive impact on blood sugar levels. Even a single carbohydrate-heavy meal (that causes a high blood sugar spike) can cause elevated blood sugar levels for the whole day, lasting even during sleep, and only returning the normal after the next day (24 hours later). The amount of carbohydrates in a meal also seems to dictate how fast the blood sugar level peaks, not just how high it rises to. Carbohydrate-heavy meals tend to peak more rapidly and to higher levels.
Black coffee (Americano in my case) has zero impact on the blood sugar level, as expected. Soy latte seems to have a minor impact on the blood sugar level (a slight rise), but is regulated and reset fairly quickly. Regular milk latte has a bigger impact, causes a fairly noticeable rise in the blood sugar level.
On Time Restrictions
Breaking a long fast (24 hours or more) with a heavy carbohydrate-heavy meal causes a massive spike in the blood sugar level. Should probably be avoided
The 18:6 TRF schedule does not seem to further lower the lowest range of blood glucose levels, compared to regular non-restricted ad lib diets. The blood sugar level seems to bottom out around the time of waking up in the morning, and remains at that level throughout the morning, even until lunch time (around noon).
A 24-hour fast does seem to bring the blood sugar levels a bit lower, compared to the 18:6 TRF schedule. This is inconclusive though. Specifically in the last 4 hours or so, the blood sugar level average went to around 5.2 $mmol/L$, compared to the 5.5-5.8 $mmol/L$ average in the morning. This was only observed in a dinner-to-dinner 24-hour fast however. The lunch-to-lunch 24-hour fast did not show the same results. The difference, if there is one, may be due to the longer continuous hours spent awake in the dinner-only fast: even though the two schedules has the same number of hours of fasting, the lunch-only fasting period is broken up by sleep. A lot more data is required to investigate further.
Miscellaneous
Workouts seem to have minimal impact on blood sugar levels. A slight rise is observed on the cardio workout day (day 1), but not on the weight training days. Overall, there isn’t enough data to say anything more.
Observed one severe instance of “sugar crash”, or reactive hypoglycemia, where blood sugar levels dip to really low levels after a sudden rise or peak, as a result of the associated insulin spike. During this time, I felt the jittery, restless sensation that I’ve experienced on occasion in the past. It’s the first time that I am able to directly connect the feeling to low blood sugar.
General Thoughts
Almost no food or drink consumption that has any caloric content can hide from the blood sugar measurements. Even a single piece of chocolate shows up on the data. This experiment further confirmed my idea that continuous glucose monitoring is the gateway into passive caloric intake tracking. Currently, with wearables like the Apple Watch, physical activity (i.e. calories out) can be passively tracked fairly accurately, but food intake (i.e. calories in) cannot. CGMs complete the picture, and I think will be the next major step up in capability for health-focused wearables.
However, even with a CGM, fully passive tracking may not be accurate, since different kinds of food (e.g. carbohydrate-heavy vs. ketogenic) can cause different levels of reactions on the glucose reading. The user may need to be prompted for at least the general type of food consumed.
I have gained a lot of sympathy for people suffering from diabetes, and am very grateful that I don’t have it. It was not exactly fun to have a sensor embedded in my stomach for several days. It’s not bad, but definitely slightly uncomfortable and inconvenient at times. On top of that, having to worry about blood sugar levels as a matter of life-and-death is very different from merely checking it for nutritional data. Insulin pumps or injections are even more intrusive, both physically for the body and in the life of the patient.